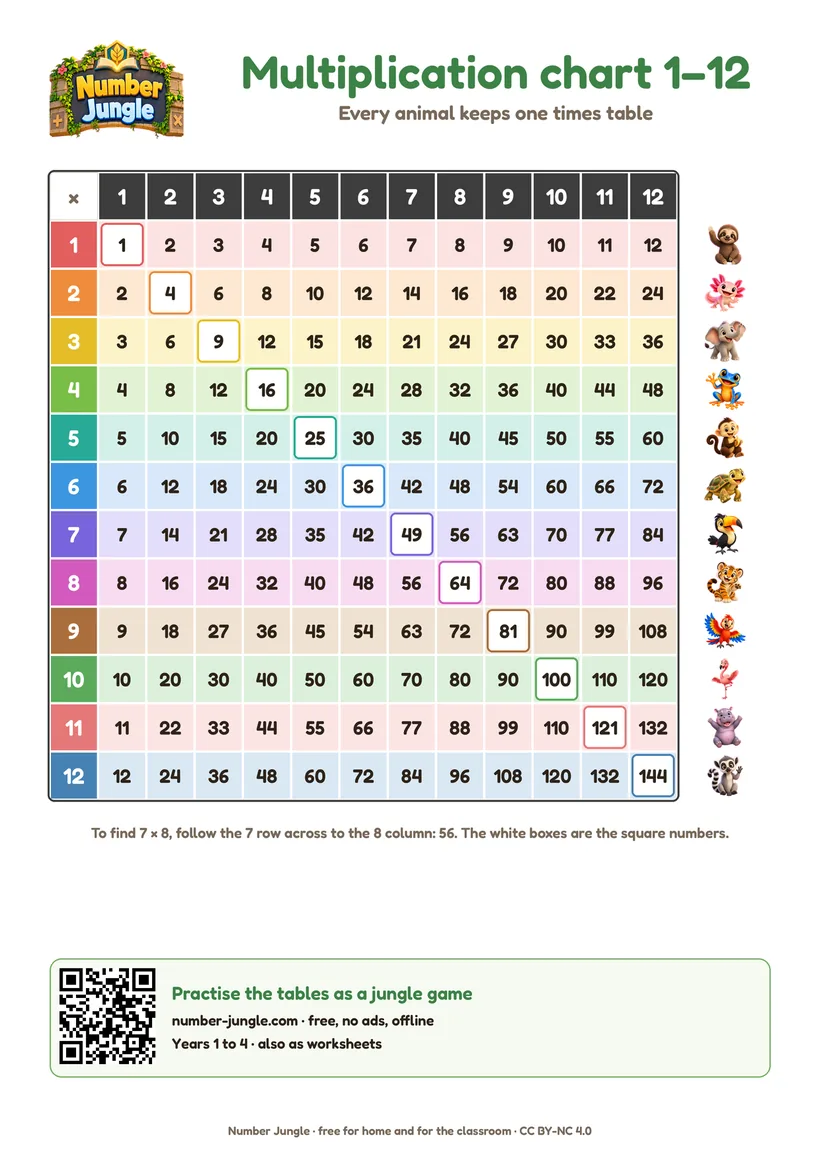
Multiplication chart 1–12, colour
The full 12 × 12 grid. Every times table is one colour and one jungle animal keeps it; the square numbers run down the diagonal in white boxes. A4 and US Letter.
Download PDFA free multiplication chart to print, as a PDF in two sizes: 1 to 12 and 1 to 10. Each comes in colour, in an ink-saving black-and-white version and as a blank grid to fill in, on A4 and US Letter. Every times table is one colour and one jungle animal keeps it, so a child finds "the 7s" at a glance. The square numbers run down the diagonal. No sign-up, free for home and for the classroom.
The full 12 × 12 grid. Every times table is one colour and one jungle animal keeps it; the square numbers run down the diagonal in white boxes. A4 and US Letter.
Download PDF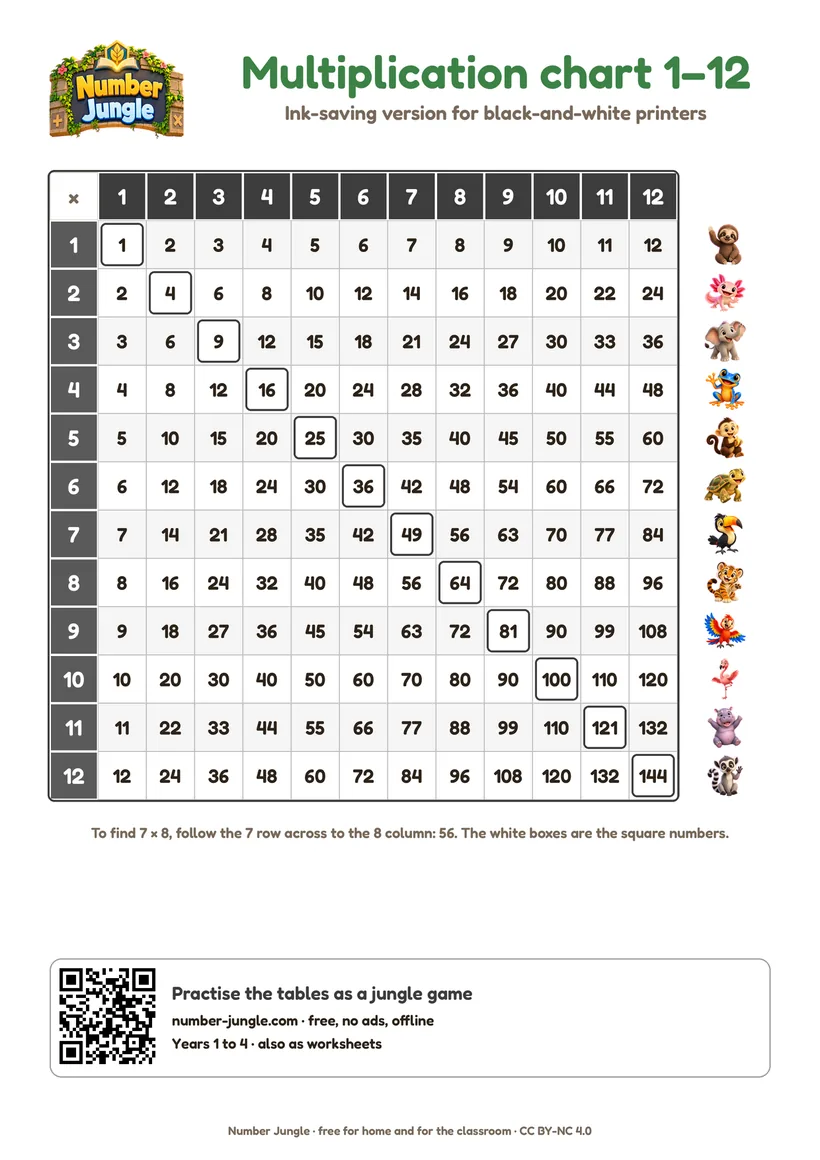
The same grid in black and white for any printer: grey header cells, thin lines, the square numbers framed. Prints cleanly from a school copier.
Download PDF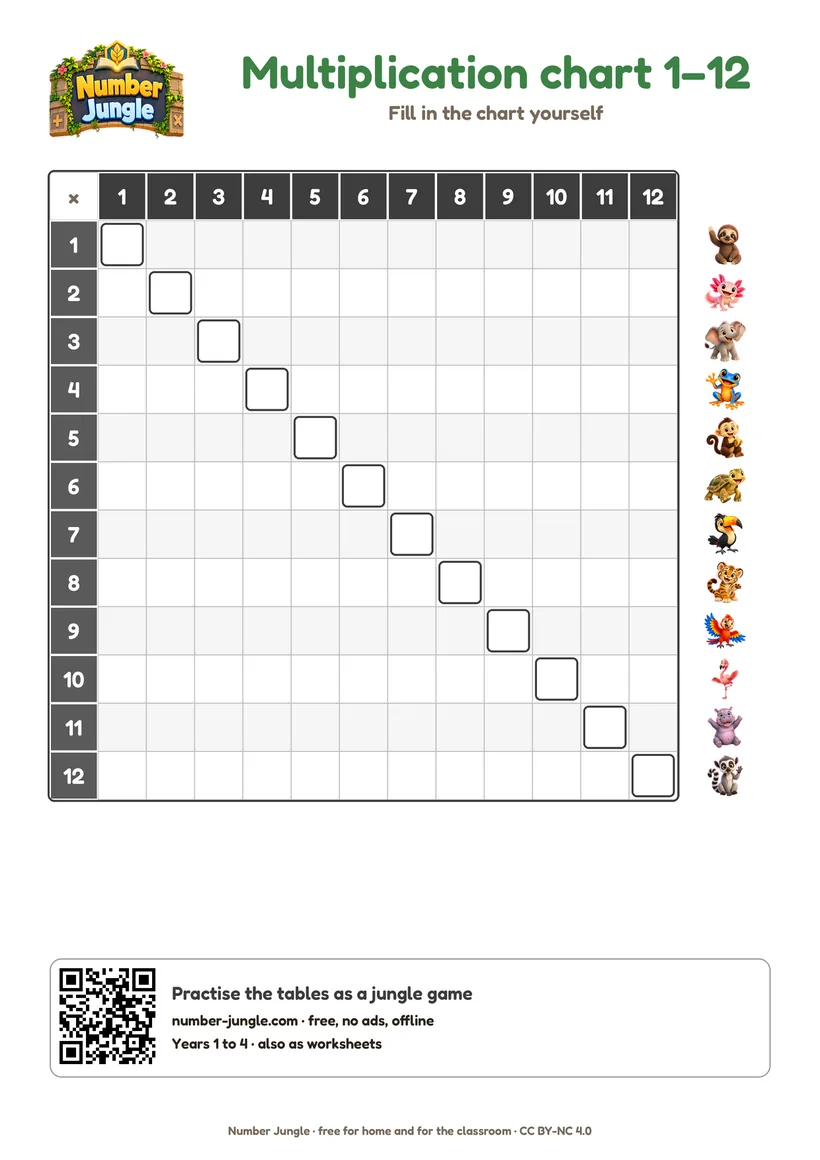
The empty 12 × 12 grid with only the headers filled in. For a timed fill-in, for one table at a time, or for checking what is secure.
Download PDF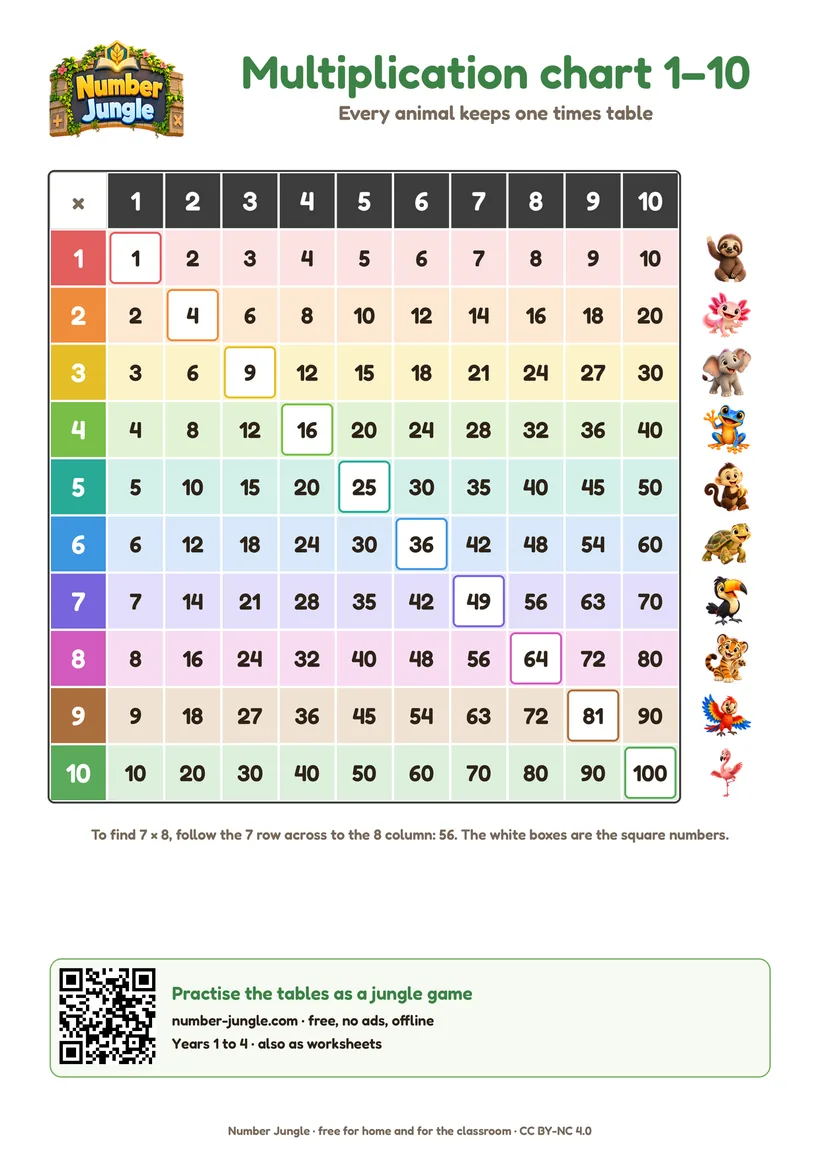
The 10 × 10 grid for Years 2 and 3, bigger cells, the same colours and animals. This is the chart most primary classrooms use first.
Download PDF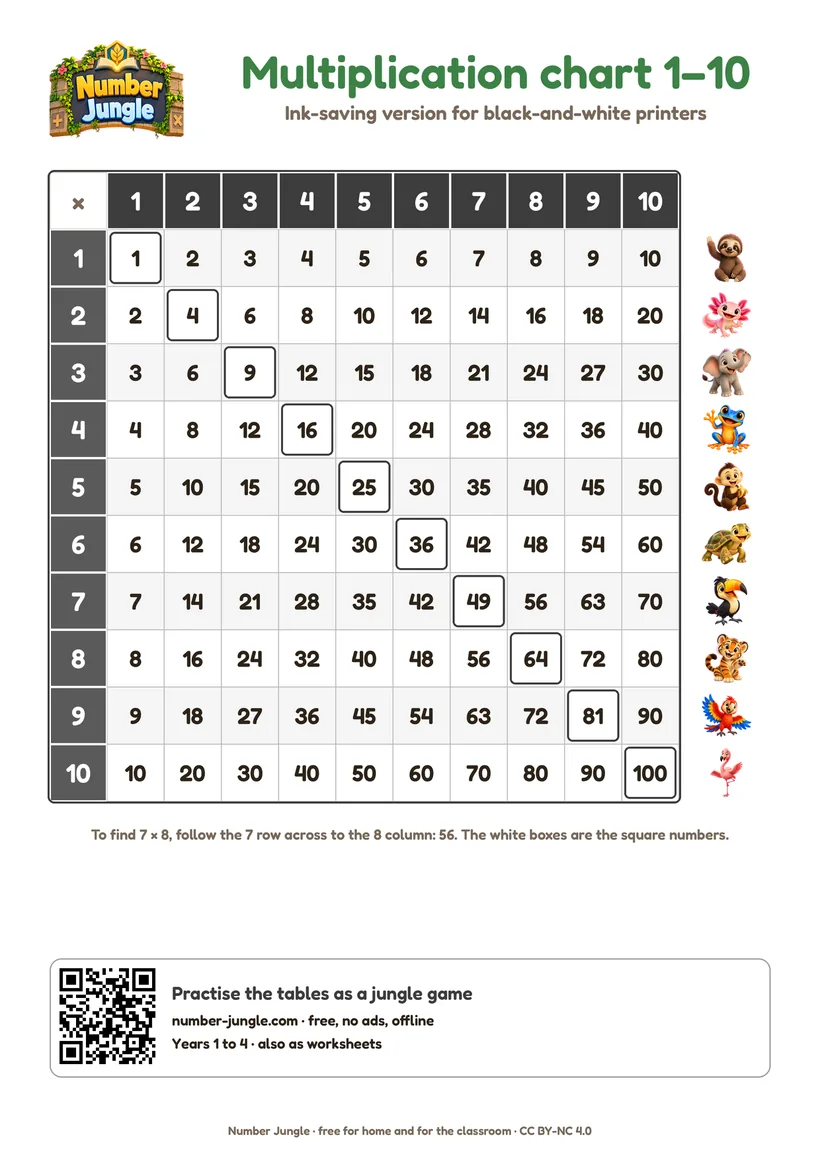
Black and white, bigger cells, for the copier.
Download PDF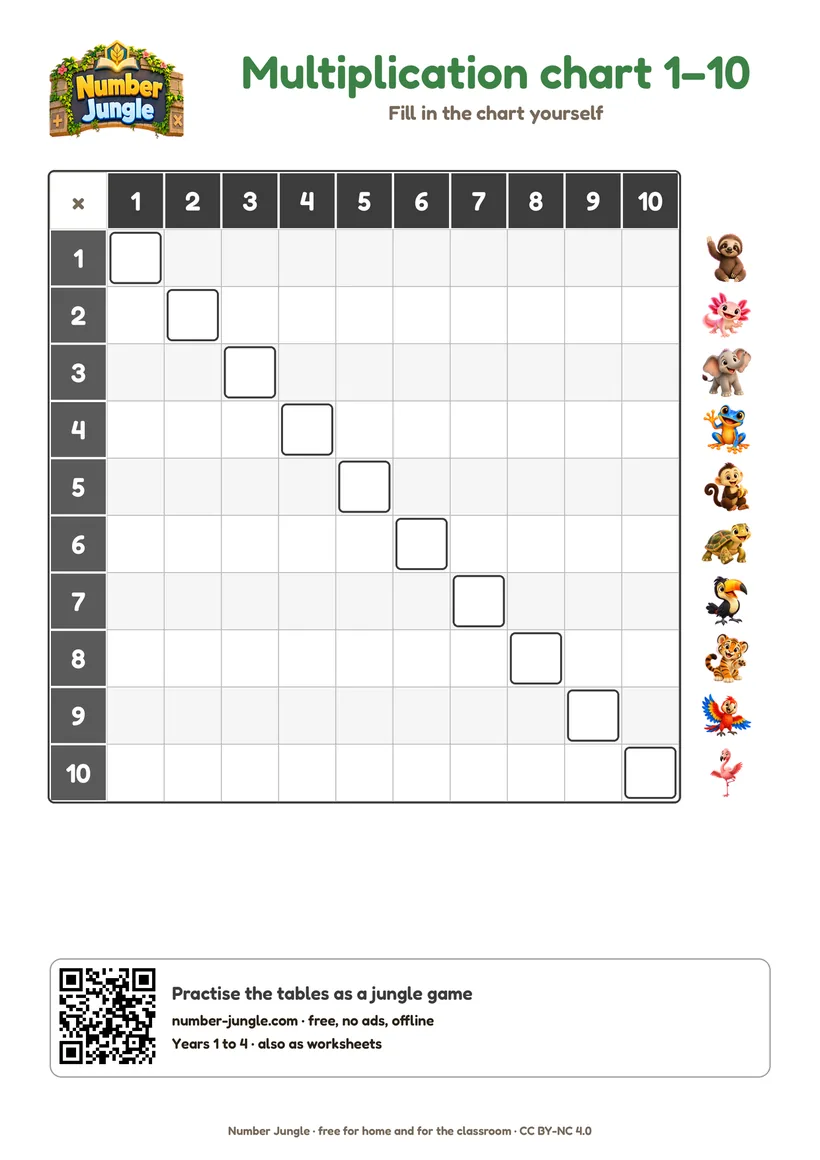
The empty 10 × 10 grid to fill in.
Download PDFFree for home and the classroom. Licence: CC BY-NC 4.0, so feel free to print, copy and pass it on, just don't sell it. If you share the sheet online, please link to this page. CC BY-NC 4.0
One table at a time? Every table has its own page with the facts, tricks and a worksheet: 2, 3, 4, 5, 6, 7, 8, 9, 10, 11 and 12. In Year 4 in England, the Multiplication Tables Check practice sheets test all of them in the format of the check.
They have the easiest patterns, so children learn them in Year 2. Cover the rest of the chart and let your child read just those three rows.
Put a finger on the 2 row and the 4 row: every number in the 4 row is twice the one above. The same from 4 to 8, and from 3 to 6.
In the 9 row the digits of every answer up to 9 × 10 add up to 9, and the tens digit is one less than the number you multiplied by.
Once the 2s, 5s, 10s, squares and the doubling rows are secure, the facts children still get wrong cluster in the 6, 7, 8 and 9 rows. Circle them on the chart and practise those six.
The 1–10 chart matches what most countries teach in Years 2 and 3 (the 1 to 10 tables, the game Number Jungle stops there too). The 1–12 chart is the one for England, where the Year 4 Multiplication Tables Check asks the 2 to 12 tables, and for the US, where charts to 12 are the norm. The blank chart is a good weekly check: filling in the 1–10 grid takes a fluent child three to four minutes.
In Number Jungle your child runs through the jungle and dashes through the gate with the right answer. The same problems, matched to their school year, with no ads and offline. Free for Android, iPhone and iPad.
More about the game →For a child in Year 2 or 3 (Grade 2), the 1–10 chart: it has bigger cells and only the tables they are learning. From Year 4 (Grade 3) print the 1–12 chart, which is what the Multiplication Tables Check in England and most US classrooms expect.
Yes. All the PDFs are CC BY-NC 4.0: print, copy and hand them out as much as you like. Only selling them is not allowed. If you put the chart online, link to this page.
Open the PDF and print at 100 % on A4, or use the US Letter version for Letter paper. The ink-saving version is black and white for school copiers. The colour chart also prints well at A3 for the wall.
A times table lists one table in a column: 7 × 1 = 7, 7 × 2 = 14 and so on. A multiplication chart (also called a multiplication grid or multiplication square) shows all the tables at once as a grid, so you can look any fact up and see the patterns between the tables.
The twelve animals are the jungle animals from Number Jungle, the free maths game by the same maker. A child remembers "the toucan's table" more easily than "the 7s", and the animal in the row is a landmark when looking a fact up.
Three ways: fill in one table a day along its row; fill in the whole grid against the clock once a week and compare the times; or fill in only the square numbers on the diagonal first, then build the rest from them.